LineChart Example
The example shows how to create a simple line chart.
Running the Example
To run the example from Qt Creator, open the Welcome mode and select the example from Examples. For more information, visit Building and Running an Example.
Creating Line Charts
To create a line chart, a QLineSeries instance is needed. Let's create one.
QLineSeries *series = new QLineSeries();
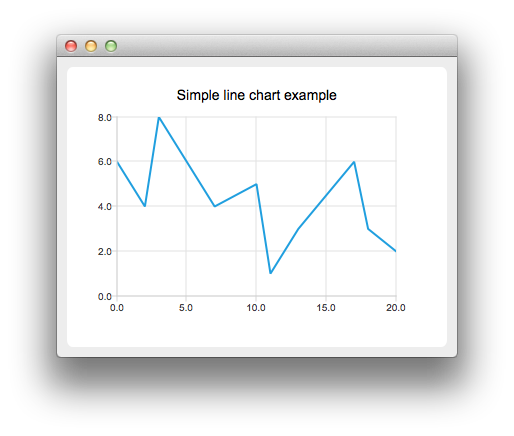
Then we add data to the series. We can use the append() member function or use the stream operator.
     series->append(0, 6);
     series->append(2, 4);
     series->append(3, 8);
     series->append(7, 4);
     series->append(10, 5);
     *series << QPointF(11, 1) << QPointF(13, 3) << QPointF(17, 6) << QPointF(18, 3) << QPointF(20, 2);
To present the data on the chart we need a QChart instance. We add the series to it, create the default axes, and set the title of the chart.
     QChart *chart = new QChart();
     chart->legend()->hide();
     chart->addSeries(series);
     chart->createDefaultAxes();
     chart->setTitle("Simple line chart example");
Then we create a QChartView object with QChart as a parameter. This way we don't need to create a QGraphicsView scene ourselves. We also set the Antialiasing on to have the rendered lines look nicer.
     QChartView *chartView = new QChartView(chart);
     chartView->setRenderHint(QPainter::Antialiasing);
The chart is ready to be shown.
     QMainWindow window;
     window.setCentralWidget(chartView);
     window.resize(400, 300);
     window.show();