StocQt
A configurable stock chart for 100 stocks.
The StocQt application presents trend charts for a custom list of 100 stocks based on the NASDAQ-100. It allows the user to choose stocks from a list, and fetch the required data from the Financial Modeling Prep API using QNetworkAccessManager or from an offline dataset. The application also allows for favoriting up to 5 stocks for use in comparison charts.
The application uses several custom types such as Search, StockCheckBox, StockChart, StockView, and SettingsView. These types present the stock data in a readable form and let the user customize the trend chart. For example, the user can choose to view the weekly, monthly, quarterly, or half-yearly trends in the stock price.
The application uses a custom StockEngine singleton implemented in C++ for data handling, such as API requests and favoriting stocks. It implements a custom APIHandler class for fetching the online data.
 void ApiHandler::stockHistory(const QString &symbol,
                               std::function<void(QList<HistoryData>)> onComplete)
 {
     if (m_useLiveData) {
         QDateTime sixMonthsAgo = QDateTime::currentDateTimeUtc().addMonths(-6);
         QString to = QDateTime::currentDateTimeUtc().toString(m_dateFormat);
         QString from = sixMonthsAgo.toString(m_dateFormat);

         QString url = QString("https://financialmodelingprep.com/api/v3/historical-price-full/"
                               "%1?from=%2&to=%3&apikey=%4")
                           .arg(symbol, from, to, m_apiKey);

         m_getRequest.setUrl(QUrl(url));
         QNetworkReply *reply = m_accessManager.get(m_getRequest);

         connect(reply, &QNetworkReply::finished, [reply, this, onComplete]() {
             QString replyStr = QString(reply->readAll());

             if (reply->error() != QNetworkReply::NoError) {
                 qDebug() << "Network error" << reply->errorString() << reply->readAll();
             }
             QByteArray data = replyStr.toUtf8();
             QList<HistoryData> dataList = parseHistory(&data);
             onComplete(dataList);
             reply->deleteLater();
The application uses the ObjectModel type to access visual data models that it depends on.
     id: mainWindow
         ...
     ListView {
         id: root
         ...
         model: ObjectModel {
             Item {
                 id: stockContainer
                 width: root.width
                 height: root.height
                 StockView {
                     id: stockView
                     anchors.fill: parent
                     visible: false
                     width: root.width
                     height: root.height
                 }

                 StockListView {
                     id: listView
                     visible: true
                     anchors.fill: parent
                     width: root.width
                     height: root.height
                 }
             }

             FavoriteView {
                 id: favoriteView
                 width: root.width
                 height: root.height
             }

             SettingsView {
                 id: infoView
                 width: root.width
                 height: root.height
             }
         }
     }
The StockListModel is a custom data model listing the stocks with basic information such as stock ID, name, value, and favorite. This application uses this data model when the user wants to choose another stock from the list.
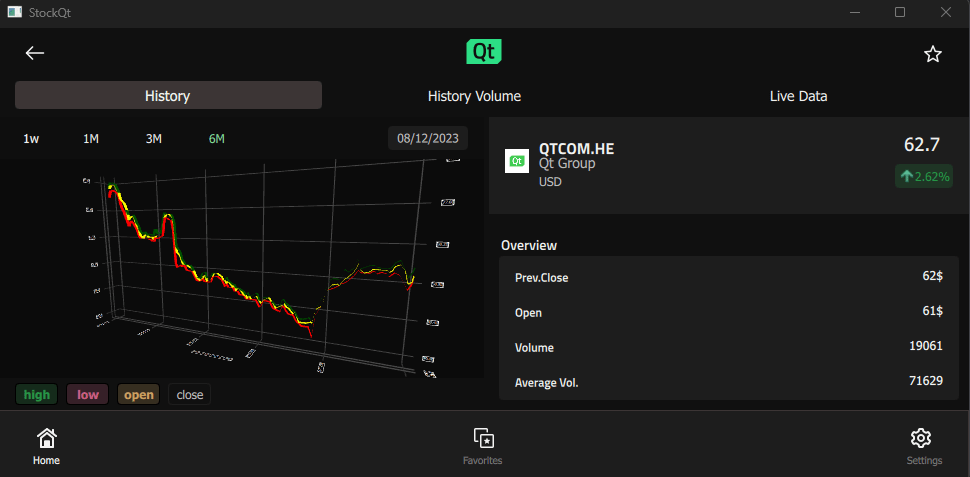
StockView and FavoriteView are complex data models that present a trend chart for the selected stock or a group of up to 5 stocks. They use another custom type, StockChart or FavoriteChart, which loads the data from the StockEngine into ListModels and presents the graphical trend of the stock price using a Surface3D, Bars3D, or Scatter3D.
 Rectangle {
     id: chart
         ...
     function updateHistory(){
         updateStartDate()
         var startPoint = StockEngine.stockModel.indexOf(startDate)
         var totalPoints = StockEngine.stockModel.historyCount()

         var width = startPoint / 50
         for (var i = 0; i < totalPoints; i++) {
             var epochInDays = StockEngine.stockModel.historyDate(i, false) / 86400
             appendSurfacePoint(openModel, width, epochInDays, StockEngine.stockModel.openPrice(i))
             appendSurfacePoint(closeModel,width, epochInDays, StockEngine.stockModel.closePrice(i))
             appendSurfacePoint(highModel,width, epochInDays, StockEngine.stockModel.highPrice(i))
             appendSurfacePoint(lowModel,width, epochInDays, StockEngine.stockModel.lowPrice(i))
         }
         ...
     Surface3D {
         id: historyGraph
         ...
             Surface3DSeries {
                 id: highSeries
                 visible: true
                 baseColor: "green"
                 flatShadingEnabled: true
                 drawMode: Surface3DSeries.DrawSurface
                 itemLabelFormat: "Time: @xLabel High:@yLabel$"
                 ItemModelSurfaceDataProxy {
                     itemModel: highModel
                     rowRole: "row"
                     columnRole: "column"
                     yPosRole: "value"
                 }
             },
The SettingsView presents information on the application as well as a dropdown menu for choosing between offline and live data. Using live data also requires the user to provide an API key.
 Rectangle {
     id: rectangle
         ...
                     function handleKey(keyValid) {
                         if (keyValid) {
                             invalidText.visible = false
                             confirmation.visible = false
                             StockEngine.setUseLiveData(true)
                         }
To understand the application better, browse through its code using Qt Creator.
Running the Example
To run the example from Qt Creator, open the Welcome mode and select the example from Examples. For more information, visit Building and Running an Example.
See also QML Applications.